
This blog lets demystify the confusion matrix and understand it with the help of simple examples.
The name confusion matrix itself creates a kind of confusion and it becomes a little difficult to understand the matrix for the first-timers, but with practice and regular use of the models, one becomes comfortable with them.
Let us Start then!!
Confusion Matrix
The confusion matrix is a Classification Metric, used in classification problems in Machine Learning. The Confusion matrix is one of the evaluation metrics available to evaluate how well the algorithm is performing.
Why do we need to evaluate algorithms?
We need them as they check the performance of the classifier that is used in the algorithm. The classifiers help to build models e.g. Logistic Regression algorithm will use a Logistic Regression Classifier in Sklearn Python Library.
Likewise, all the algorithms are evaluated and the algorithm giving the best results as shown by the metrics is selected as suitable for that classification problem.
Further examples will make things clear, so smile.
Diagram of Confusion Matrix
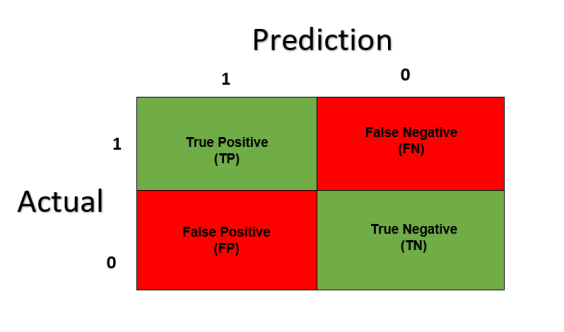
On X-axis here we have Predicted values; these values are predicted by the classifier.
On Y-axis, we have Actual values. Notice there are Two classes mentioned 0 and 1.
True Positive/TP: TP is the correctly identified class
True Negative/TN: TN is the correctly rejected for a certain class
False Positive/FP: FP is the incorrectly identified instances for a certain class
False Negative/FN: FN is the incorrectly rejected instances for a certain class.
Confusion Matrix Sklearn Python
Let’s take the example of Heart Disease Prediction.
With the help of images, we will understand the Confusion matrix. The algorithm used here is Random Forest and Random Forest Classifier is giving an accuracy of 85.7% on the test data.
The confusion matrix seen below is manually created. You can access the blog heart disease prediction in python to get the complete code.

The Classifier’s Performance
- It correctly identified 34 cases with having no disease.
- It wrongly classifies 6 cases with no disease as having the disease (this is not good when it comes to the medical field)
- It correctly identifies 44 cases having diseases
- It wrongly identifies 7 cases as having the disease but is classified as having no disease.
One important point to note for this problem: Positive classes are denoted by 0 or No-disease and negative class is denoted by 1 or disease.
In medical sciences, banking, and finance industry wrong classification costs trouble.
The patients diagnosed with a disease but in reality have no disease suffer unnecessary trauma and the reverse is also true. Thus, we need to assure that the classifier used is very robust. To ensure this we have another classification metric called classification report showing precision, recall, F1 score, Support, and other details.
To know more about classification metrics refer to the blog Machine Learning Metrics.
