
Titanic Survival Prediction data set, the main task is to predict whether the passenger will survive or not. The survived column has two values where 0 indicates Not Survived, and 1 indicates Survived.
I shall go step by step with the first step been downloading the data, loading the data, and basic libraries . Moving forward with data exploration, data wrangling(cleaning) , data visualization, training our data and finally making predictions , finding out the accuracy of the model.
The details of the data set can be understood as we look into it step by step. So, let’s get started.
To download the data : just type on google download titanic data set csv, you can download it from Kaggle https://www.kaggle.com/c/titanic/data. Download the 3 files in case you are participating in the ongoing competition; and if you are just here for practice then we can stick with train.csv file (one of the data files)

DATA ANALYSIS AND VISUALIZATION
For further exploring the data, let us visually represent the data in order to get a better idea. Seaborn, Matplotlib data visualization libraries in Python are used in this Machine Learning Project.


Dropping Columns
Drop the less significant columns in this case Cabin. the Cabin column is not conveying much information as insights can be gathered from other columns like PClass, Embarked etc. Hence, i dropped the Cabin Column. Also, check for any null values, if present we drop all the null values using dropna() function in Python.


Model Building Process
Prepare the model before it is given as an input to the Machine Leaning(ML) Algorithm. The ML Algorithms do not understand categorical or any other data, which are not numbers, Hence, I will convert the columns with categorical data(Sex, PClass, Embarked) into numeric using One Hot Encoding.
ONE HOT ENCODING
One-Hot Encoding simply creates one column for every possible value and put a 1 in the appropriate column.
I will convert a few columns into categorical data to perform Logistic Regression, as Logistic Regression takes categorical /binary values. get_dummies() function is used to Convert categorical variable into dummy/indicator variables. For more information visit the Pandas documnetation: https://pandas.pydata.org/pandas-docs/stable/reference/api/pandas.get_dummies.html


Training the Model
To train the model, first perform the train, test split and then Logistic Regression Algorithm is applied on to the data.
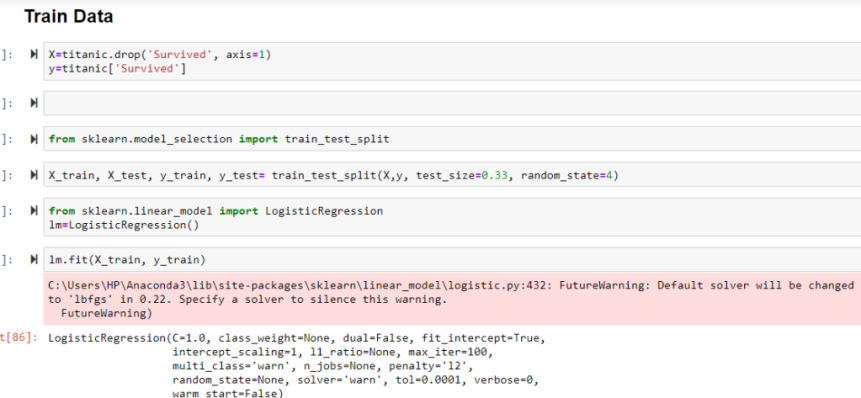
Note : You can change the random state to get different result.
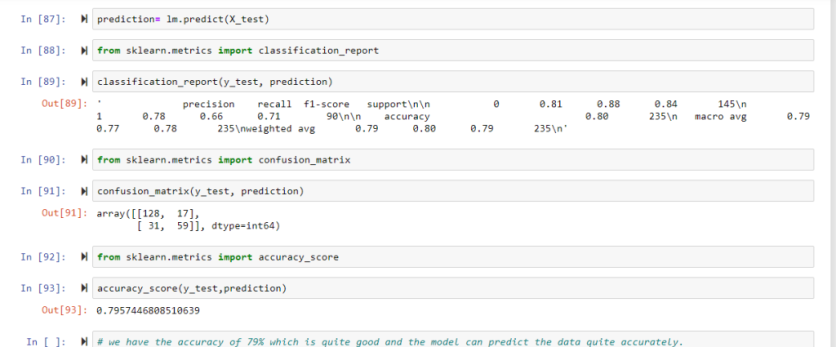
Concluding Remarks
I notice here that accuracy score is close to 80% which makes our model a good model to predict the values accurately , here in Titanic data set our model accurately predicts as to who will survive and who will not survive.
Through Visualization we found out that females have more chances of survival than males, class 1 have more changes of survival, youth age group 20-35 yrs male from class 3 have not survived.
Further, other Machine Learning Algorithms can be applied on the same data set, Ensemble algorithms to boost the performance of the model and get good predictions

