
Kindly find the file by following these steps: Type on Google : Uber raw data-click on first link of Github– click uber trip data-click uber raw data april.csv- below u will fine view raw-save this link.


We will analyse the data of Uber for the month of April. We will derive few key observations from the data like :which day the rides were the highest or lowest, which place people traveled more and much more..
Let’s start , we’ll play with this data in out Jupyter notebook.
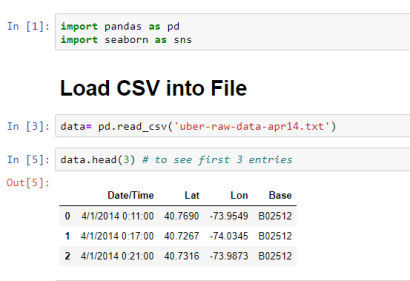


Now we will manipulate the data to make it more meaningful:
Now, we will add some columns in the dataframe , here we will add dom(date of the month/ date), weekday, hour in order to analyse the data better.

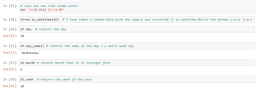
Now we will do add some columns in the dataframe , here we will add dom(date of the month/ date), weekday, hour in order to analyse the data better.


In the next blog we will visualize the data and analyze it too.

